Our approach begins with how we think about the production process: the business is not selling products; it’s selling time on the line as if the company were renting out it’s production assets.
What the business should be asking is:
- What products should I be prioritizing on my line to increase the line’s hour by hour profitability?
- What is the profit rate or EBITDA rate of every product I make and how can I relate that to key process variables?
What we commonly find is that misled preconceptions drive which products companies prioritize. Those assumptions are due to organizational silos that divide the business team and factory operators. While the business team may know the actual cost associated with wasted material, work in progress, and changeover loss, they are removed from the issues product lines face and how that upsets cycle times. It is essential to combine the knowledge from the factory floor with the business unit to deliver accurate analytics that will improve productivity and prioritization.
One reason for this silo effect is that many in the manufacturing industry have been slow on the uptake of the latest data methods. Lacking the digital infrastructure, they are unable to draw a thread through their entire process. Once the fragmented datasets that percolate the organization are combined, money patterns become clear. (i.e., product margin with process or cycle time data).
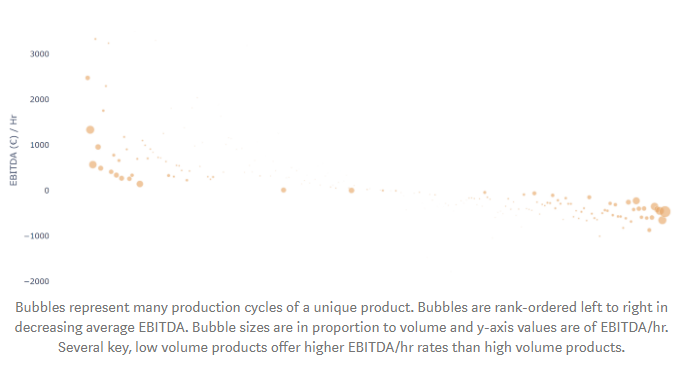
To take a simple example, rank ordering every product by EBITDA and then drawing a bubble chart of EBITDA/hr with bubble size in proportion to volume, typically results in the following: high and low EBITDA tails marked by high volume products and a long plateau of net-zero products marked by low volume. Unsurprisingly, new or experimental products lack the production volume to push margins one way or the other. In several cases, however, low volume products have a very high EBITDA/hr. If these products had the proper volume, they could potentially achieve a much higher return for the organization. If we only consider EBITDA, we lose out on the insight that we should be expanding into a few key, low volume products because pound for pound they are produced more quickly.
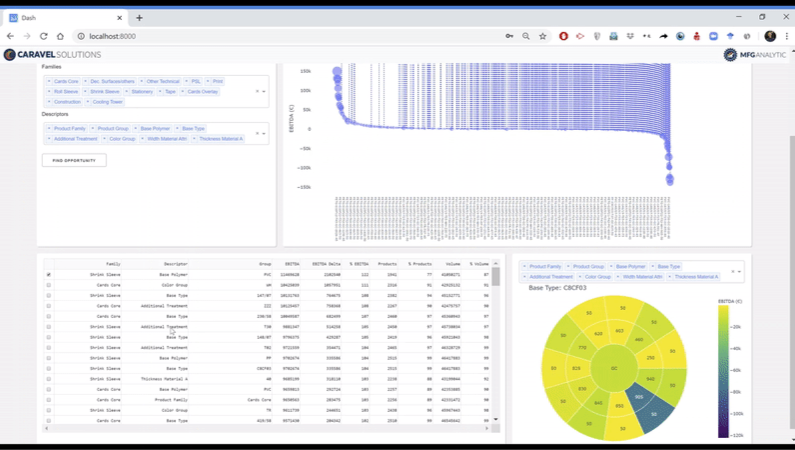
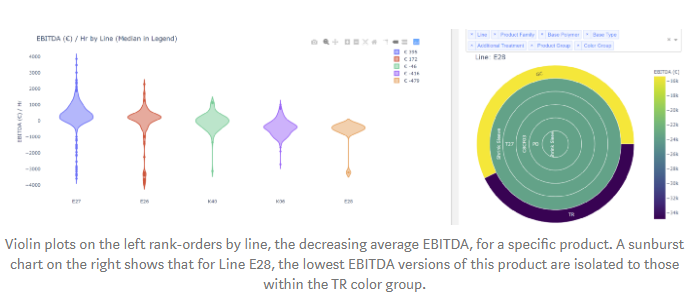
In one of our client analyses, we uncovered a correlation between their process’s key components and product profit margin. Of the many hundreds of combinations of chemical makeup, color, shape, treatment, and other factors, we were able to determine which were winners and which were losers. By incorporating these groupings into a dashboard, we were able to ask questions on-the-fly: if we were to swap out this combination for this one, it would likely have this impact on our margin, but will it still fit within the end customer’s needs — no? — well, how about this combination? And so forth. It streamlined client sessions, allowing us to quickly develop actionable plans around which segments of their process we could target, drastically increasing their profitability.
Smart, analytics powered dashboards are an indispensable tool in telling the analytics story. When stakeholders within the organization are attempting to articulate to other business segments the priority of an initiative, they can easily revert to the data. It’s one thing to have an algorithm pick out what process variables are important. It’s another if it then transforms that insight into metrics and plots that can drill down and roll up the subject matter in an intuitive way. There’s indispensability in creating a path down which all organizational segments can walk and speak the same language.
To recap, we started with the fact that the manufacturing industry has been slow on the digitalization and data science uptake, but they’re starting to pick it up quickly. At MFG Analytic, we want our clients to be on the forefront of that wave. The start of your digital journey begins with analytics and by fully leveraging the datasets existing within today’s organization. Before spending a fortune “sensoring up” every pump, tank, and heat exchanger in the plant, use what’s already available. Find out what you know, and make your next digitalization step an informed one — one backed by data.
Click here to view the post in Medium.
Preparing for the Post-Coronavirus world.
Organizations are ramping up tech adoption and relying on digital operations to maintain production and to manage the safety of a returning workforce.
We know that traditional process automation software can be a long, complex, and expensive deployment. At Caravel and MFG Analytic we know your problems; our team of industry experts can hit the ground running right now to help you assess your needs and develop a solution when and where you need it most.
We are ready to roll up our sleeves and work with your team on concept development, implementation, training and more.